
Wisp Science使用技巧:轨迹
查看原文让 AI 帮忙分析一份数据,最后收到一句“分析完成”,往往还不够。我们还想知道:它读的是哪个文件?执行了什么代码?绘图失败时,报错来自哪里?过几天再回头看,能不能找回当时的操作过程?
Wisp Science 的 轨迹 功能,就是用来查看这些过程的。它把一段对话中的用户输入、助手回复、工具调用和模型用量按顺序组织起来,让你可以从结果往前追,找到具体做过的那一步。
前两篇介绍了 MCP 和 Skills。这一篇介绍如何打开轨迹、读懂记录,以及怎样用它核对分析和排查问题。
本文配图来自 Wisp Science 实际前端界面,使用演示数据展示一段“检查差异分析结果表,再尝试绘图”的会话。文件名、代码、报错与用量均为教学示例,不代表已完成的科研分析。
先认识轨迹:把一次任务的执行过程展开来看。
假设你让 Wisp 检查一份差异分析结果表,再根据它绘制火山图。这个任务中可能发生多次工具调用:读取表格、检查列名、处理缺失值、执行绘图代码。如果中间报错,还会有检查和重试。
轨迹会把这些记录按“轮”分组。你发送一条消息,就开始一轮;这一轮下面列出 Wisp 为回应它而产生的记录。
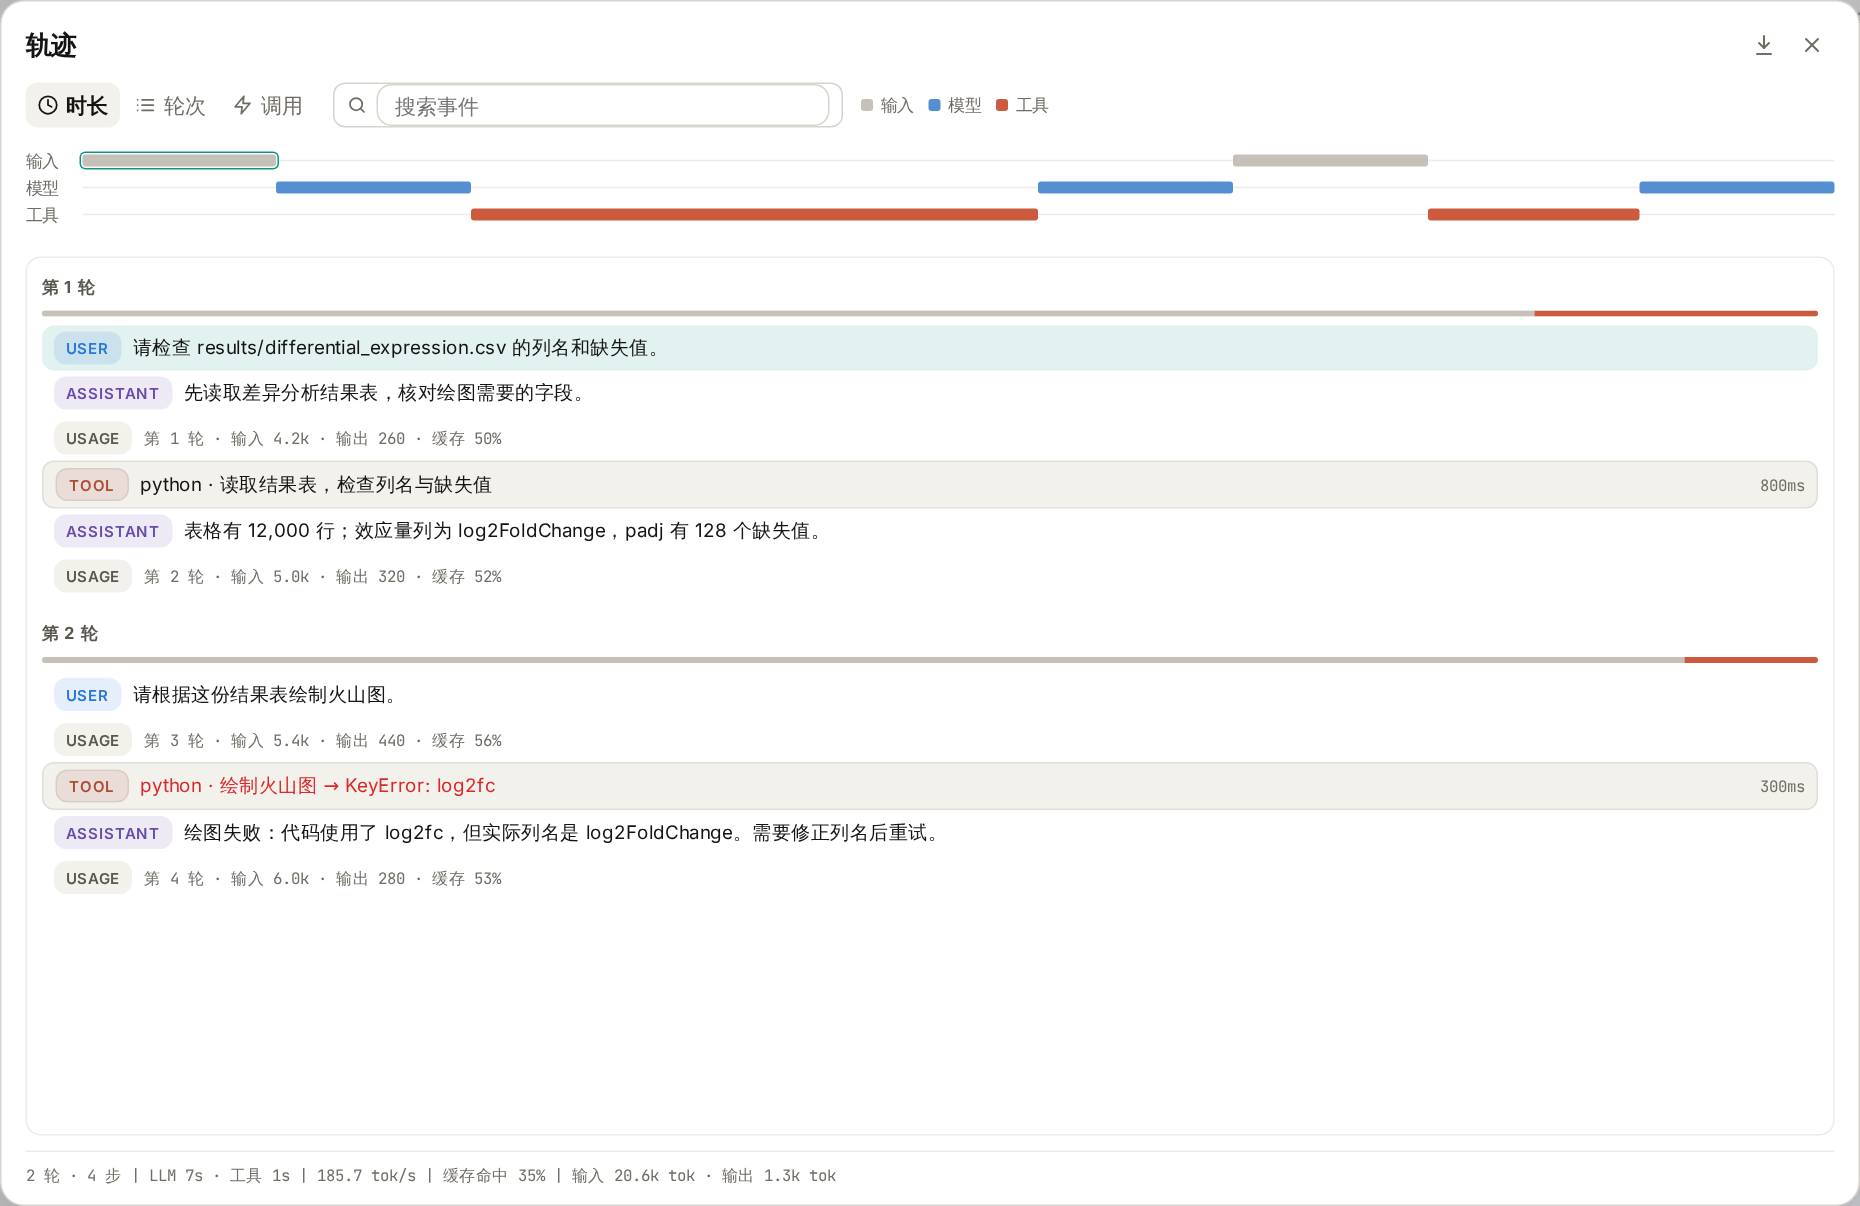
图 1:演示会话分为两轮,先检查数据,再尝试绘图。关闭右侧详情后,可以更宽地浏览事件列表。
常见记录可以这样读:
| 记录 | 表示什么 | 适合核对什么 |
|---|---|---|
| USER/用户 | 你发送的任务要求 | 当时指定了哪个文件、哪些条件 |
| ASSISTANT/助手 | 模型给出的回复 | 它如何解释结果、准备怎样继续 |
| TOOL/工具 | 一次工具调用及其返回结果 | 实际参数、代码、输出与报错 |
| USAGE/用量 | 一次模型调用的用量记录 | 输入、输出和缓存 Token |
一轮对话中,模型可能多次调用工具、读取结果,再继续处理,所以同一轮下面出现多条工具和用量记录很正常。列表较窄时,记录类型会以小图标显示;展开列表后,可以看到文字标记。
打开轨迹,不需要额外配置。
进入一段对话,点击顶部工具栏中的 轨迹 图标,位置在分享按钮与收件箱铃铛之间。也可以在输入框输入 /trajectory 并发送,打开同一个窗口。
第一次使用时,建议等一个小任务完成后再打开,这样比较容易把任务要求与执行记录对应起来。新会话还没有消息时,会显示“暂无轨迹”。
窗口可以分成四块来看:
- 顶部时间线:按输入、模型和工具展示过程,可切换“时长”“轮次”“调用”刻度。
- 左侧事件列表:按轮次浏览每一步,已完成的工具调用会显示耗时,失败调用用红色突出显示。
- 右侧详情:点击一条记录,查看它的内容。
- 底部统计:查看整个会话的轮数、步数、模型与工具耗时,以及 Token 用量等。
点击时间线中的一段,也可以定位到对应事件,并把它滚动到列表上方。只想浏览列表时,点击右侧详情区域的关闭按钮即可;再次点击事件,详情会重新打开。按 Escape 或点击整个窗口右上角的关闭按钮,就会返回原来的对话。
第一个用途:核对 AI 实际用了什么文件和参数。
在演示会话中,第一条要求是:
请检查 results/differential_expression.csv 的列名和缺失值。
Wisp 随后调用 Python 读取表格。点击这条工具记录,再切换到右侧的 预览,就能看到“参数”和“结果”。
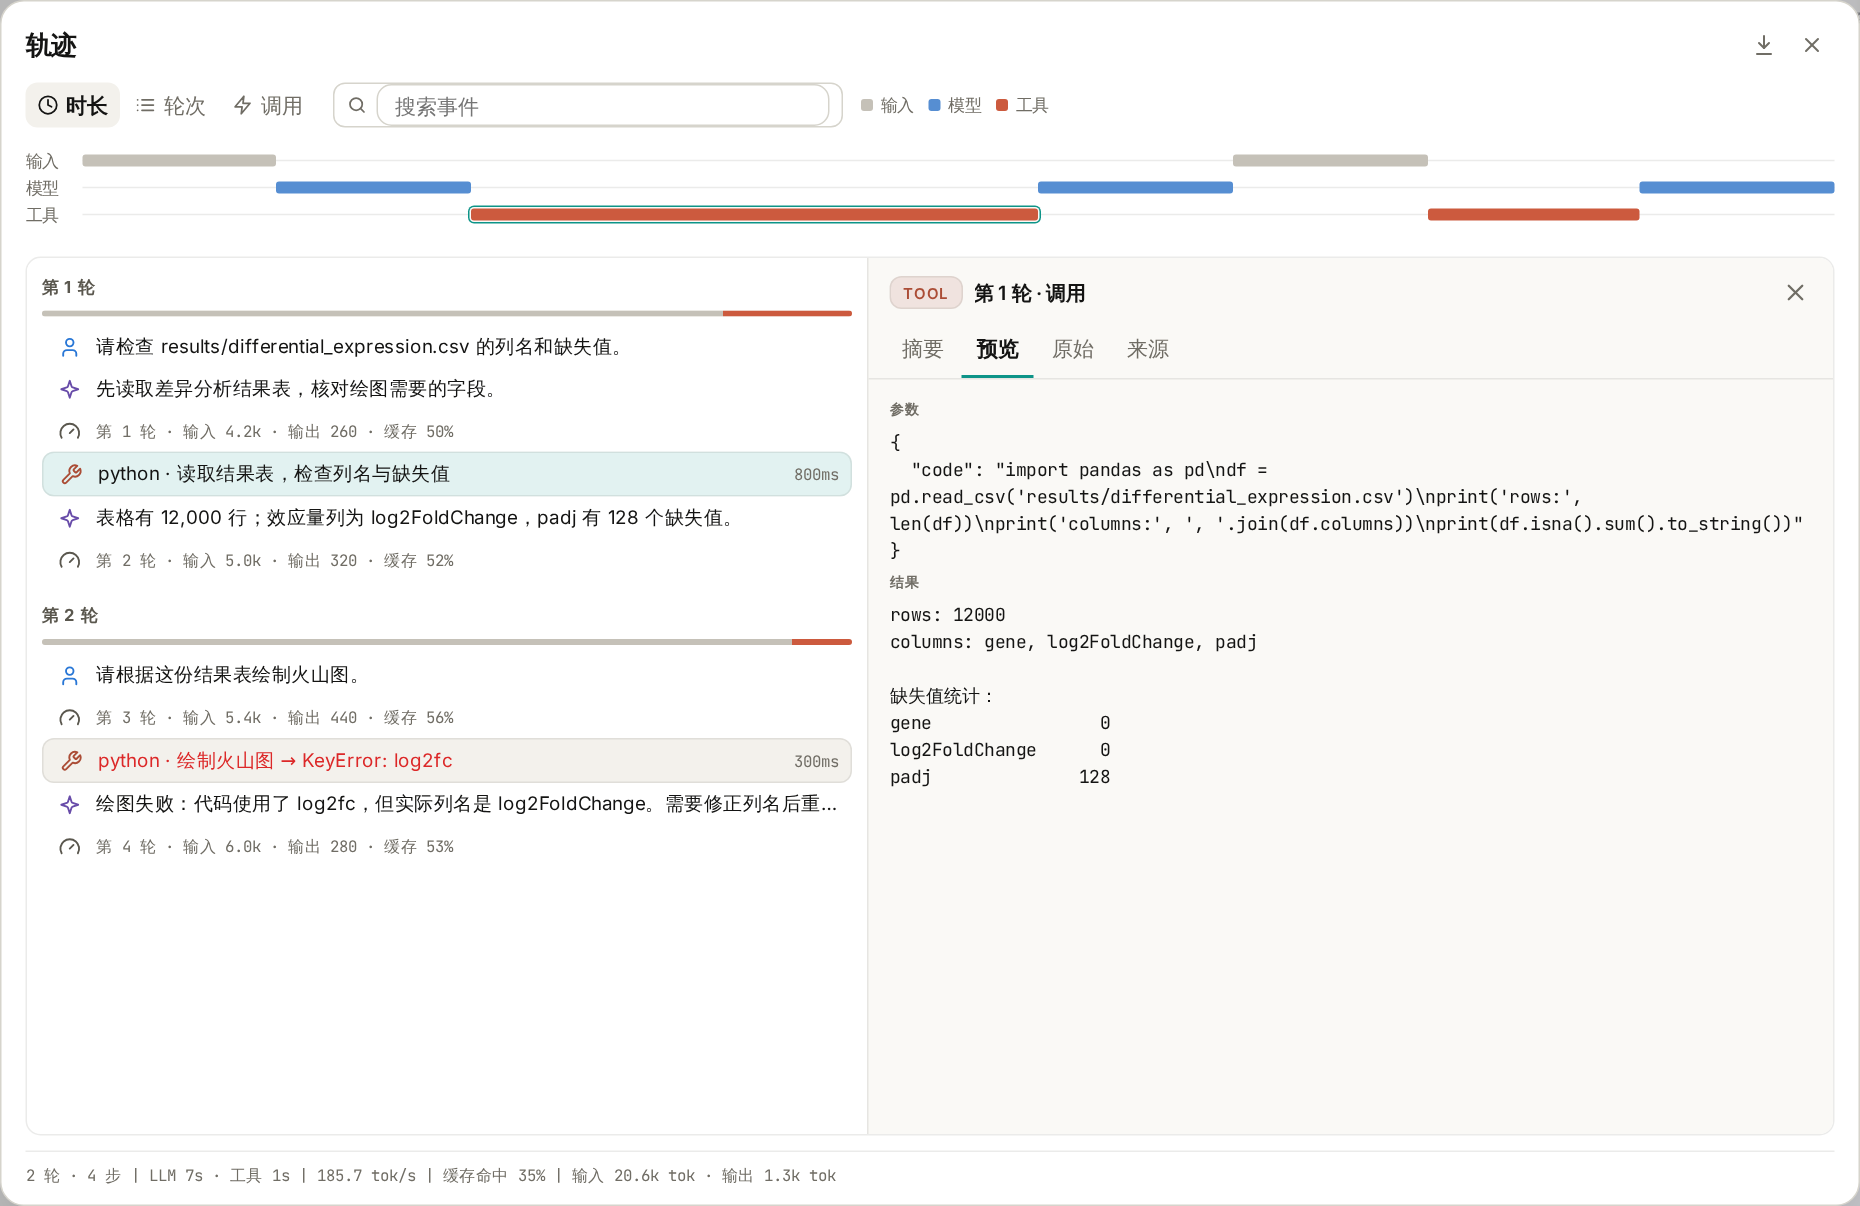
图 2:左边选择一次 Python 调用,右边查看提交给工具的代码和工具返回的内容。较长的内容可以在详情区域内滚动阅读。
这里最值得核对的,是任务要求与实际操作是否一致:读取路径是否正确,使用了哪些列,有没有过滤数据,以及输出是否支持助手的描述。
例如,演示结果表的列名是 gene、log2FoldChange 和 padj,其中 padj 有 128 个缺失值。后续绘图时,就可以继续检查代码有没有处理这些缺失值,效应量列有没有选对。
同样的方法也适用于文献检索:查看工具实际提交的检索词和返回记录,再核对助手整理的论文是否来自这些结果。使用 Skill 时,也可以查找相关工具调用,确认这次任务是否读取了对应的技能说明。
右侧还有几个标签,不必第一次就全部使用:
| 标签 | 主要内容 |
|---|---|
| 摘要 | 记录来源、状态、耗时与简短预览;用量事件还会显示模型和 Token 信息 |
| 预览 | 消息全文,或工具的完整参数与结果 |
| 原始 | 当前事件的 JSON 数据,适合需要检查具体字段时使用 |
| 来源 | 原始消息文本、工具参数或用量记录等来源内容 |
对多数科研用户来说,先用“摘要”了解状态,再用“预览”核对内容,就可以完成常见检查。
第二个用途:报错时,找到出问题的那一步。
演示中的第二轮要求绘制火山图,但绘图代码使用了 log2fc。结果表实际提供的是 log2FoldChange,于是工具返回 KeyError: 'log2fc'。
打开轨迹,点击红色的工具记录,就能同时看到出错代码和返回结果。记录较多时,可以在顶部“搜索事件”中输入 log2fc,缩小范围。
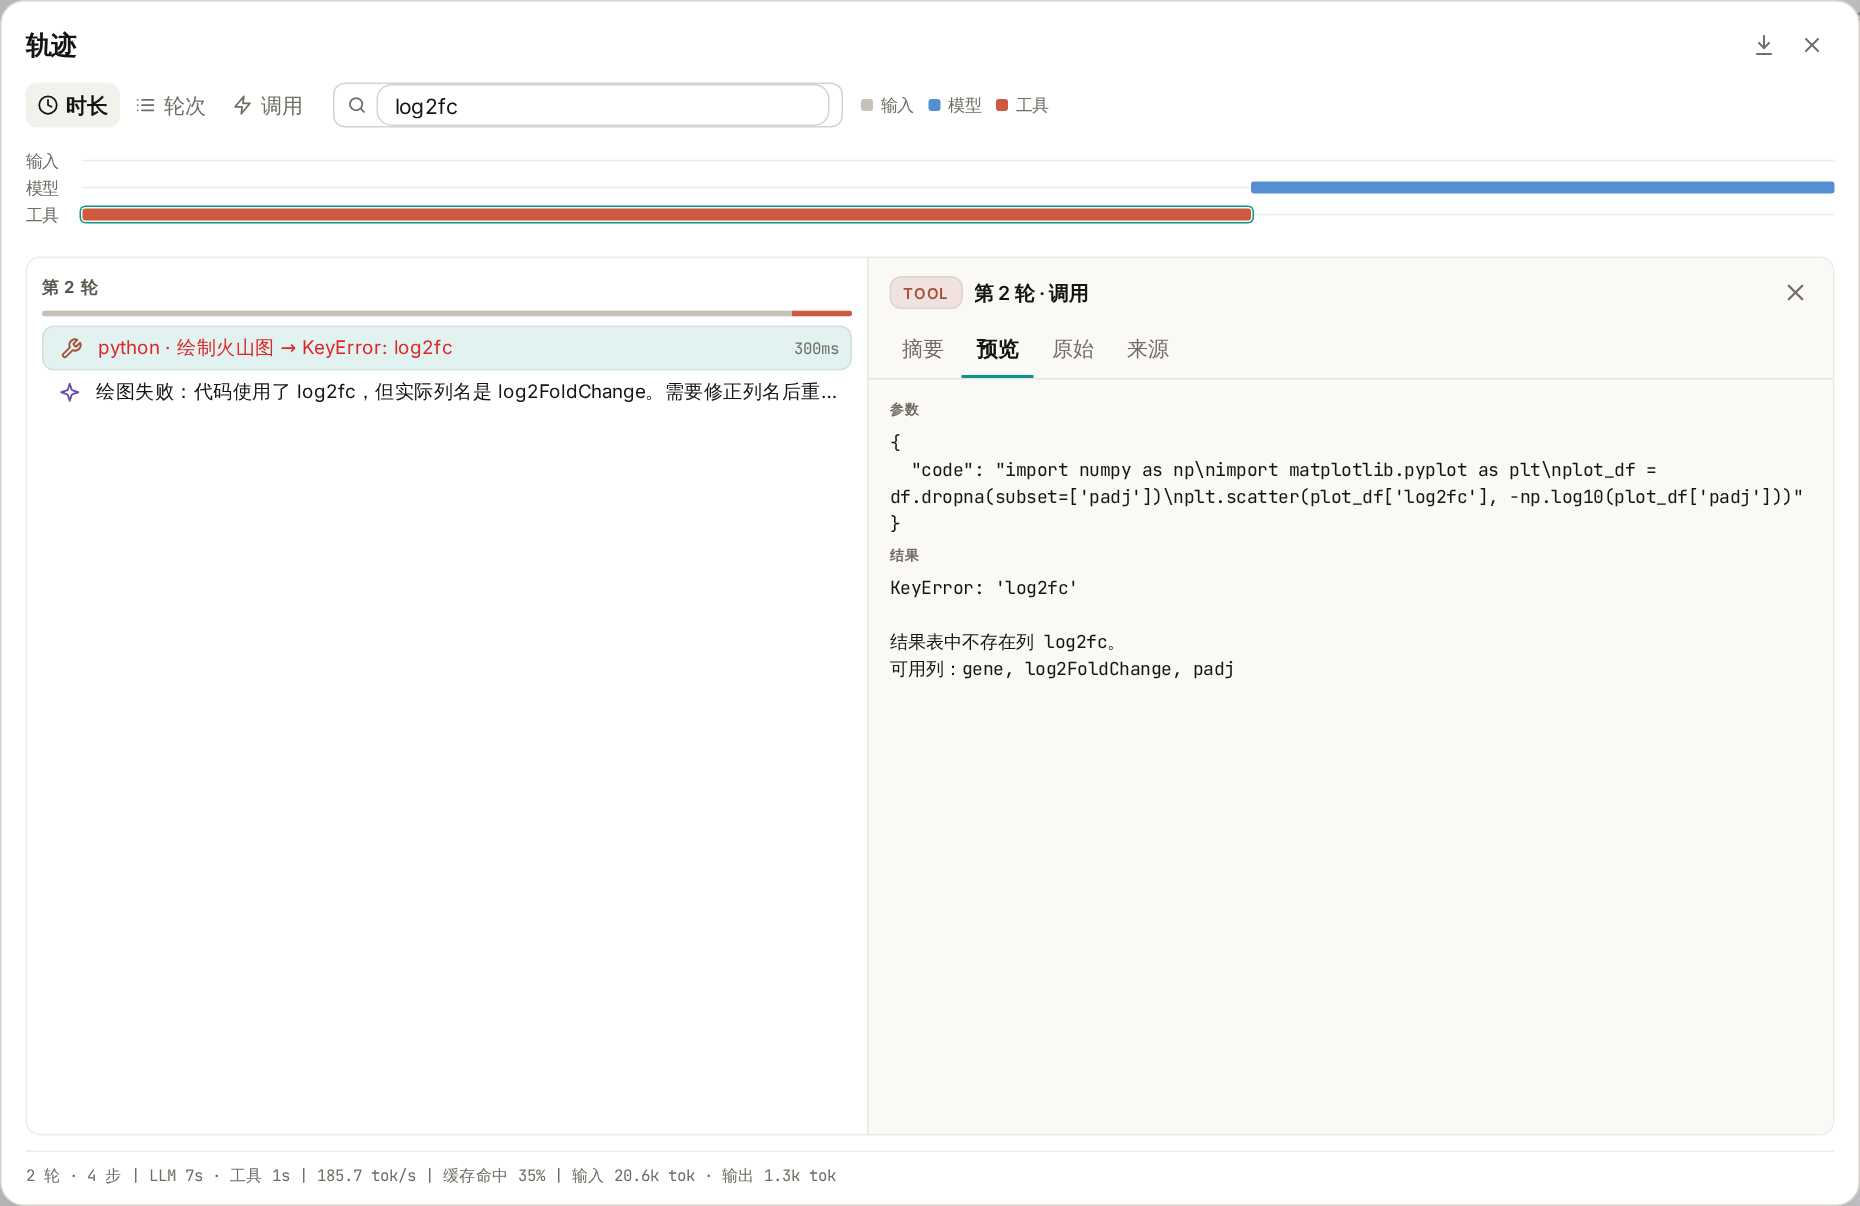
图 3:搜索会匹配事件摘要及详细内容。这个例子中,错误来自代码引用了不存在的列名。
看清原因后,可以回到对话继续提出具体要求:
刚才的绘图调用使用了 log2fc,但表格里的列名是 log2FoldChange。请先确认列名,修正后重新运行,并说明缺失值和零值如何处理。成功后告诉我图和脚本保存在哪里。
这样,后续处理就有了明确依据。重试后再打开轨迹,还可以检查新的调用是否成功、修改是否落实,以及输出是否符合预期。
排查其他问题时也可以从实际报错入手:文件不存在就核对路径,缺少依赖就核对运行环境,检索失败就查看工具返回的信息。搜索文件名、工具名或错误关键词,通常比从头翻阅整段对话更方便。
第三个用途:了解一次任务的耗时和用量。
有时任务没有报错,但等待时间很长。轨迹顶部的时间线与底部统计,可以帮助你初步判断时间主要花在模型响应还是工具执行上,再定位到具体调用。
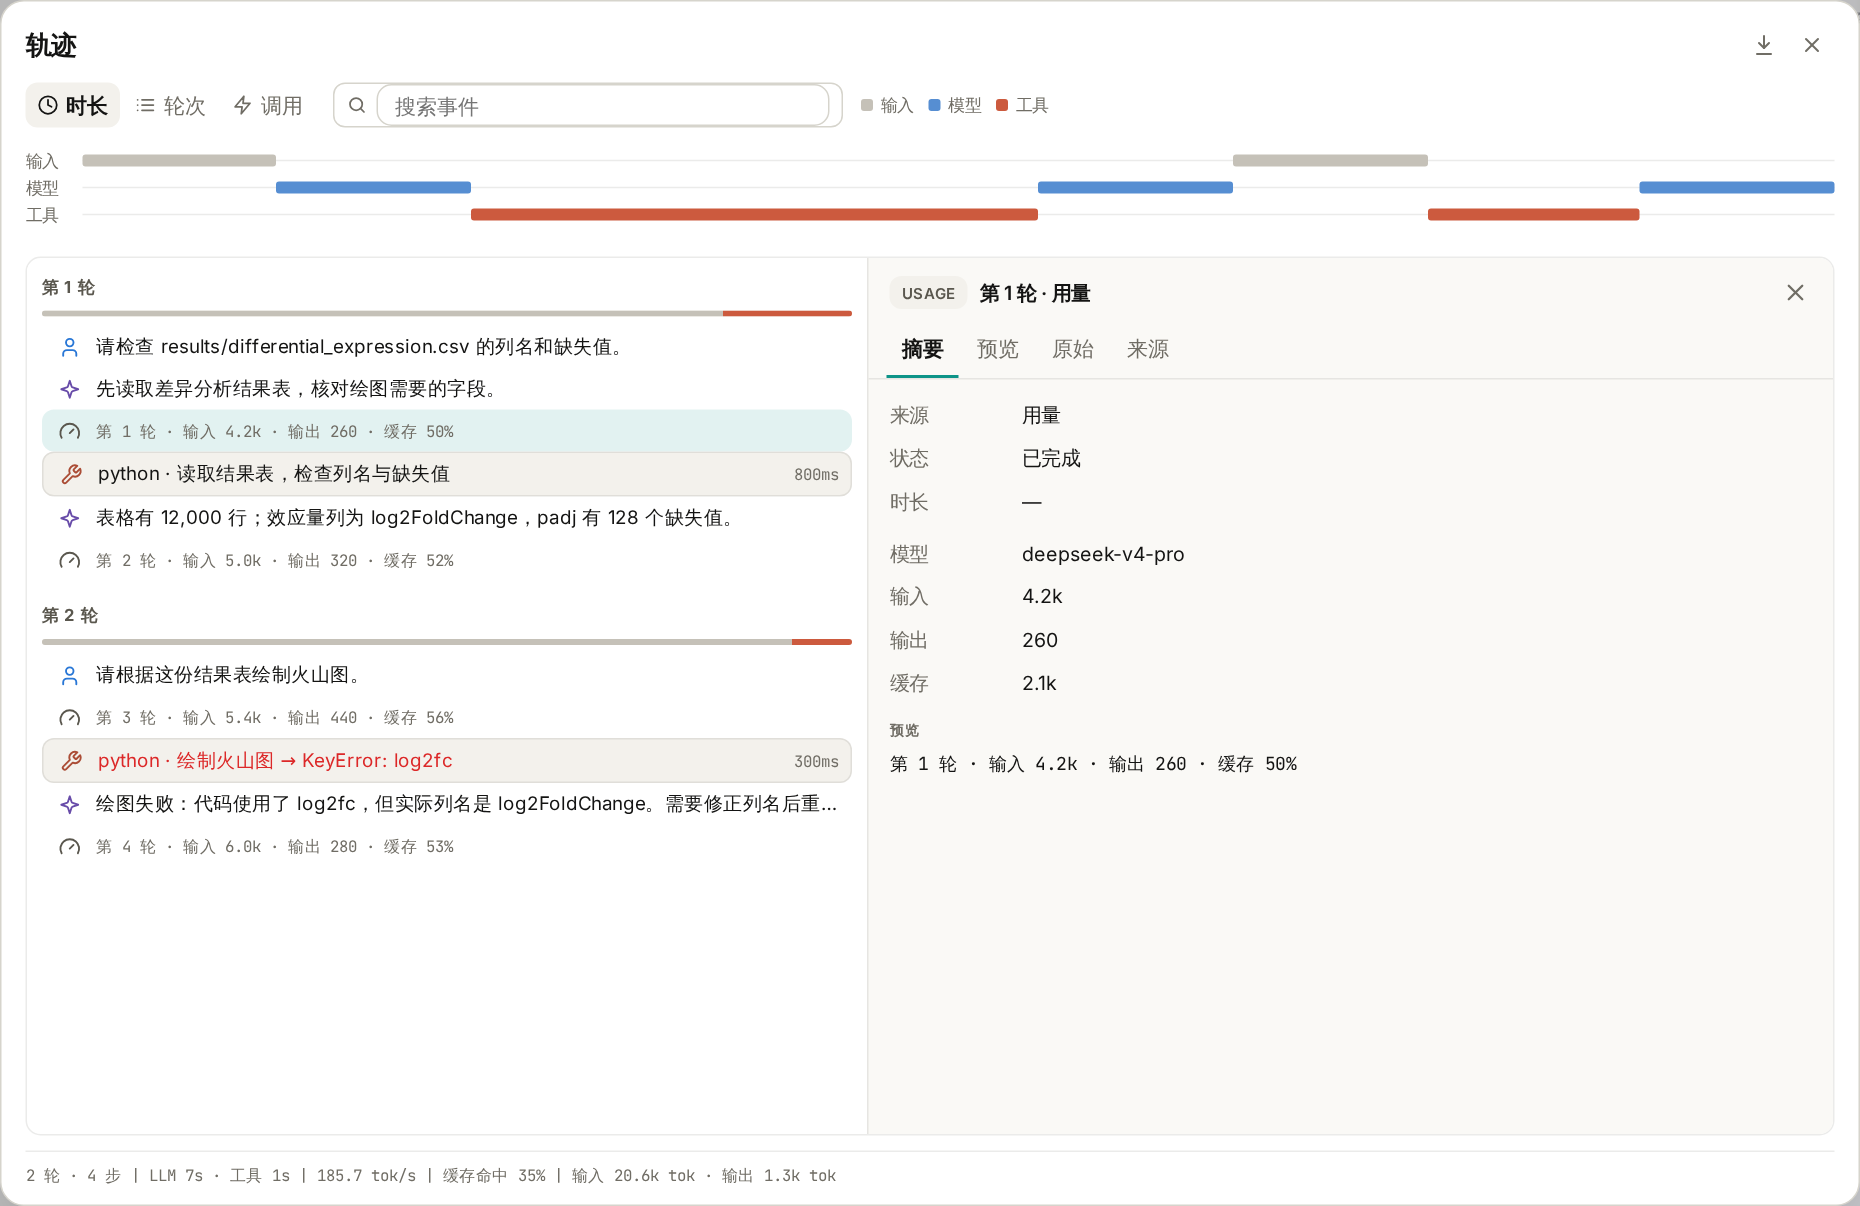
图 4:右侧显示选中那次模型调用的用量;底部汇总整个会话。图中数字仅为演示。
Token 可以粗略理解为模型处理文本等内容时使用的计量单位。用量记录会展示输入、输出和缓存信息;底部还汇总模型与工具耗时、输出速度和缓存命中率等。
这些信息适合辅助复盘,例如观察长文档输入、反复重试或多次工具调用带来的用量变化。实际费用仍要结合所用服务商的计价方式核对,不能仅凭一个 Token 总数直接换算。
运行中的轨迹会先展示即时记录,任务结束后再以已保存的记录更新。旧会话如果缺少时间或用量信息,相应指标可能无法显示,不能把缺失值理解成“没有耗时”或“没有消耗”。
需要留档或与同事复盘,可以导出 HTML。
点击轨迹窗口右上角的下载图标,也就是 导出 HTML,选择保存位置,即可得到一个独立的 HTML 文件,用浏览器打开阅读。
导出内容包括会话标识、模型、汇总统计、时间线,以及各轮的用户输入、助手回复、工具参数与结果、状态、耗时和用量记录。它适合与分析笔记一起归档,也方便同事了解你是怎样得到结果、在哪一步遇到了问题。
有两个细节很实用:
- 搜索不会缩小导出范围。 即使界面中只筛出了
log2fc相关记录,导出的仍是整个会话已保存的轨迹。 - 导出以已保存记录为准。 如果任务还在运行,尚未保存的即时内容可能不在文件中;需要完整留档时,等任务结束后再导出。
轨迹能帮助检查和追溯过程。要复现一次分析,还需要一起保留输入数据或来源、脚本、参数和运行环境;HTML 本身不会把这些文件全部打包,也不会自动重跑任务。分享前,可以检查其中完整的输入、路径和工具结果是否适合提供给对方。
第一次尝试,可以用一份熟悉的小表格。
在项目中准备一个 CSV 文件,发送下面这条要求,并把路径换成自己的文件:
请检查 data/example.csv,报告行数、列名和各列缺失值。先不要修改原文件;如果读取失败,请说明实际报错。
完成后打开轨迹,找到读取文件的工具调用,切换到“预览”,把参数、结果和最后的回答对照起来,再试着搜索文件名、导出 HTML。
熟悉这几个操作后,轨迹就可以成为日常分析的一部分:拿到结果时核对依据,遇到报错时查找原因,任务完成后保留过程,下一次接着做时也有记录可查。
功能细节参见 Wisp 轨迹文档。本文依据撰写时的项目实现整理,不同版本的界面文字可能略有差异。
When an AI finishes an analysis, “Done” is often not enough. Which file did it read? What code did it execute? Where did plotting fail? Can you return to the process a few days later?
Wisp Science's Trajectory view shows that process. It organizes user inputs, assistant replies, tool calls, and model usage so you can work backward from a result to the steps that produced it.
The previous tutorials covered MCP and Skills. Here we explain how to open a trajectory, read its records, verify an analysis, and investigate failures.
Screenshots show the real frontend in English with a demonstration conversation that checks a differential-expression table and attempts a plot. Filenames, code, errors, and usage are teaching examples, not completed scientific analysis.
Expand the execution process of a task.
Suppose you ask Wisp to inspect differential-expression results and draw a volcano plot. It may read the table, check column names, handle missing values, and run plotting code. A failure may lead to further checks and retries.
The trajectory groups these records by turn. Your message starts a turn containing the records produced while Wisp responds.
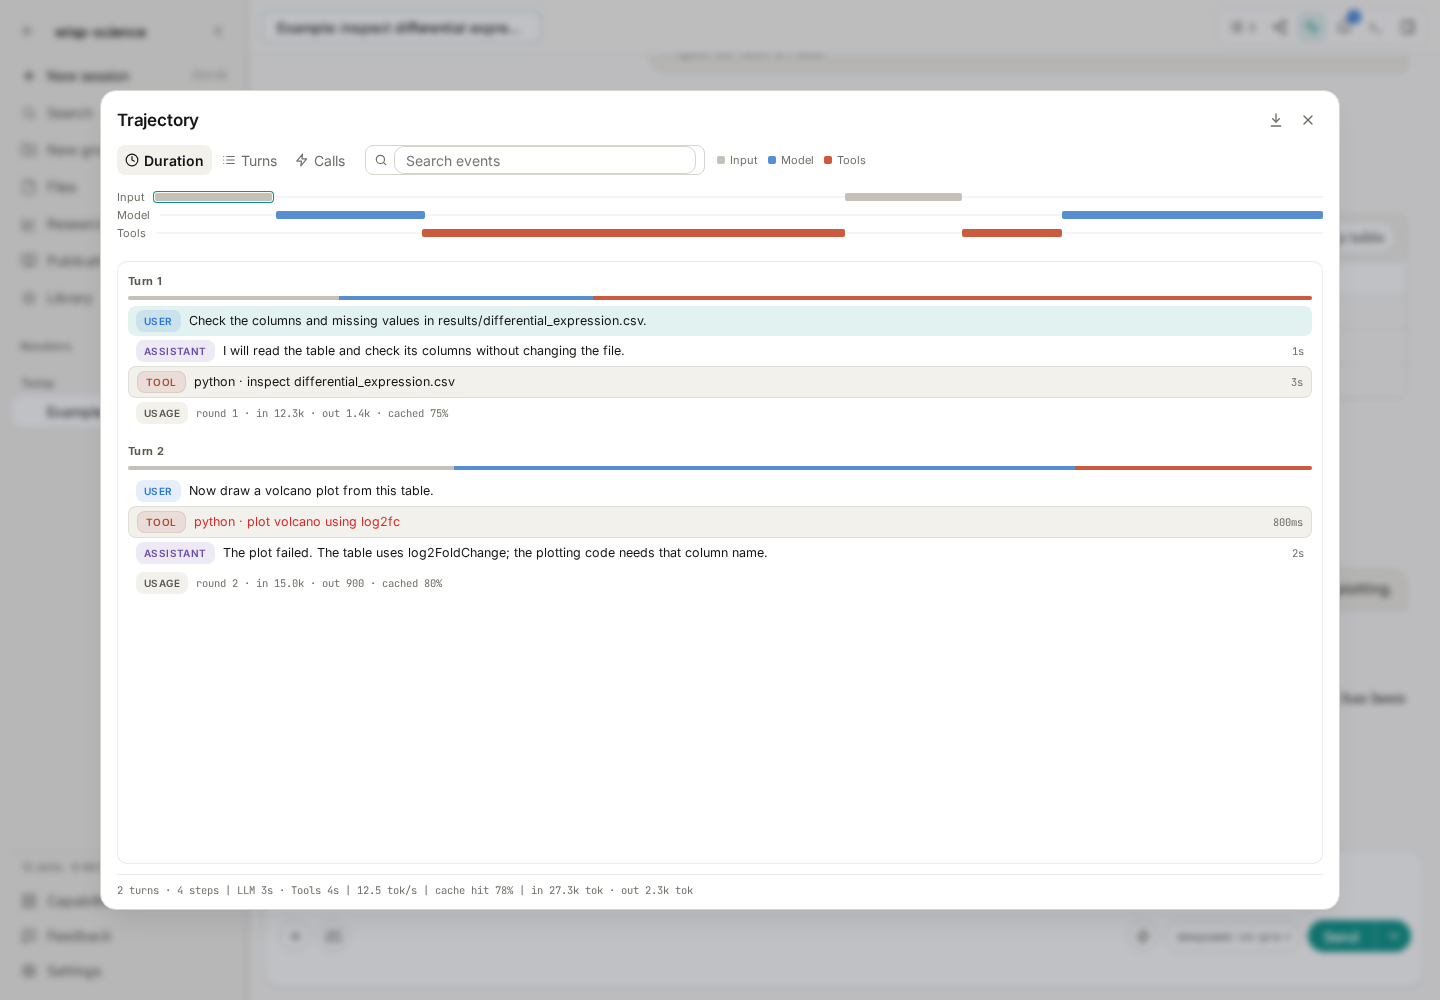
Figure 1: The demonstration has two turns: inspect the table, then try plotting. Closing the details panel provides more room for the event list.
| Record | Meaning | What to verify |
|---|---|---|
| USER | Your request | Named files and conditions |
| ASSISTANT | Model responses | Interpretation and proposed next steps |
| TOOL | A call and its returned result | Actual parameters, code, output, and errors |
| USAGE | Usage for a model call | Input, output, and cached tokens |
A model can call several tools and make several requests within one turn. Multiple tool and usage rows are normal. Narrow lists use compact icons; wider lists also show text labels.
Open a trajectory without extra setup.
Inside a conversation, click Trajectory in the top toolbar, between Share and the inbox bell. You can also send /trajectory in the message box.
For a first inspection, wait for a small task to finish so the request and execution are easier to match. An empty session shows an empty-trajectory state.
The window has four main areas:
- Top timeline: input, model, and tool activity, with duration, turn, or call scales.
- Left event list: steps grouped by turn, durations for completed calls, and failures highlighted in red.
- Right details: content of the selected record.
- Bottom statistics: conversation totals for turns, steps, model/tool time, and token usage.
Selecting a timeline segment locates its event in the list. Close the right details panel for a wider list, then select a record to reopen it. Escape or the window's top-right close button returns to the conversation.
First use: verify files and parameters.
The demonstration begins with:
Check the column names and missing values in results/differential_expression.csv.
Wisp calls Python to read the table. Select that tool record and open Preview to inspect parameters and results.
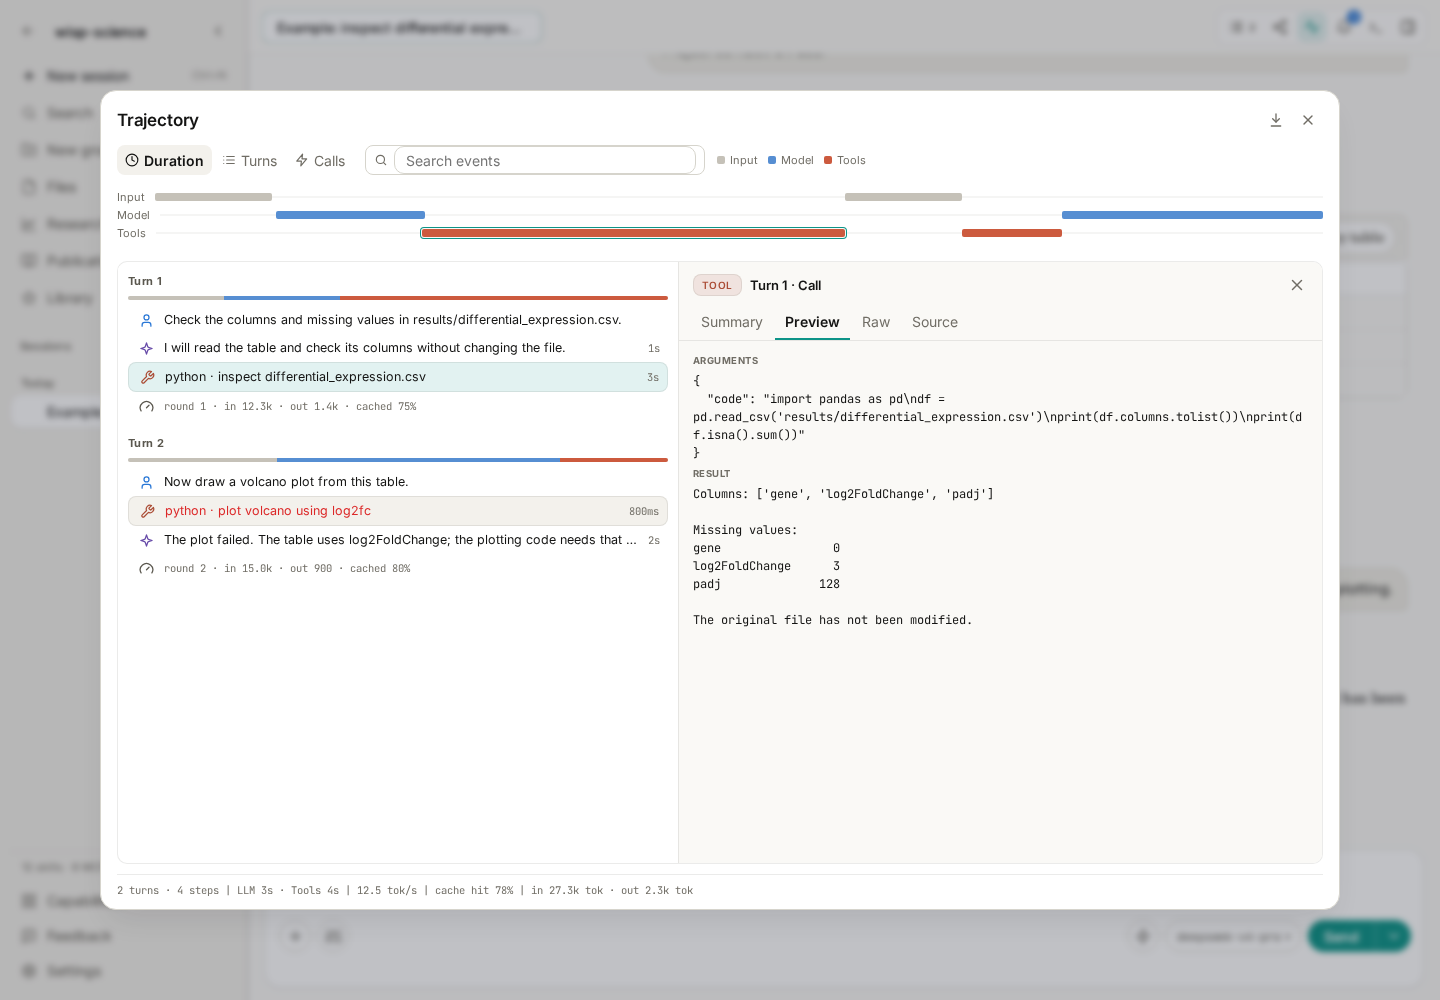
Figure 2: Select a Python call on the left and inspect its submitted code and returned content on the right. Longer details can be scrolled.
Compare the request with the operation: correct file path, chosen columns, any filtering, and whether the output supports the assistant's description.
The sample table has gene, log2FoldChange, and padj; padj contains 128 missing values. Later, check that plotting code handles them and uses the correct effect-size column.
The same approach works for literature searches: compare actual query terms and returned records with the assistant's paper list. For a Skill, look for calls showing that its instructions were read.
| Details tab | Contents |
|---|---|
| Summary | Origin, status, duration, and a short preview; usage events also show model and token information |
| Preview | Full message or complete tool parameters and results |
| Raw | Event JSON for checking individual fields |
| Source | Original message, tool arguments, or usage-source content |
For common checks, Summary followed by Preview is usually sufficient.
Second use: locate a failure.
The second demonstration turn requests a volcano plot, but the code uses log2fc where the table has log2FoldChange. The tool returns KeyError: 'log2fc'.
Select the red tool record to see the failing code and result together. Search events for log2fc to narrow a long list.
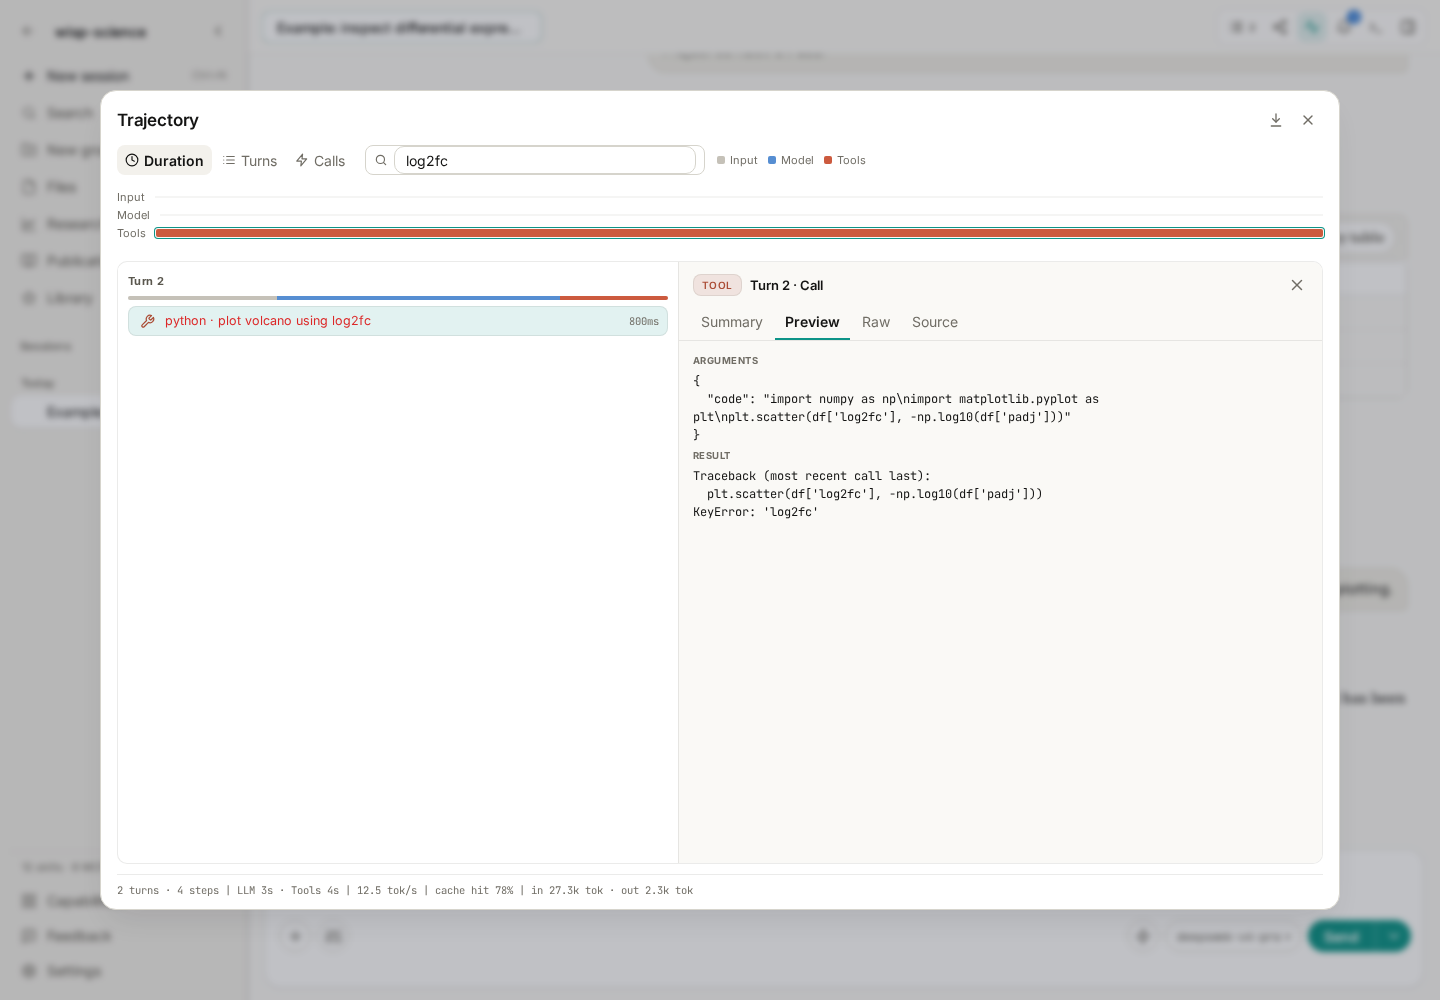
Figure 3: Search matches both summaries and detailed content. Here, the code referenced a column that did not exist.
Return to the conversation with a specific correction:
The plotting call used log2fc, but the table has log2FoldChange. Confirm the column names, correct the code, rerun it, and explain how missing and zero values are handled. If successful, report the figure and script locations.
After retrying, inspect the new calls to confirm success, implementation of the correction, and expected output.
Use actual errors for other troubleshooting too: check paths for missing files, environments for dependencies, and returned messages for retrieval failures. Searching a filename, tool name, or error keyword is usually easier than rereading the whole conversation.
Third use: understand time and usage.
A task may take a long time without failing. The timeline and statistics help distinguish model-response time from tool execution and locate individual calls.
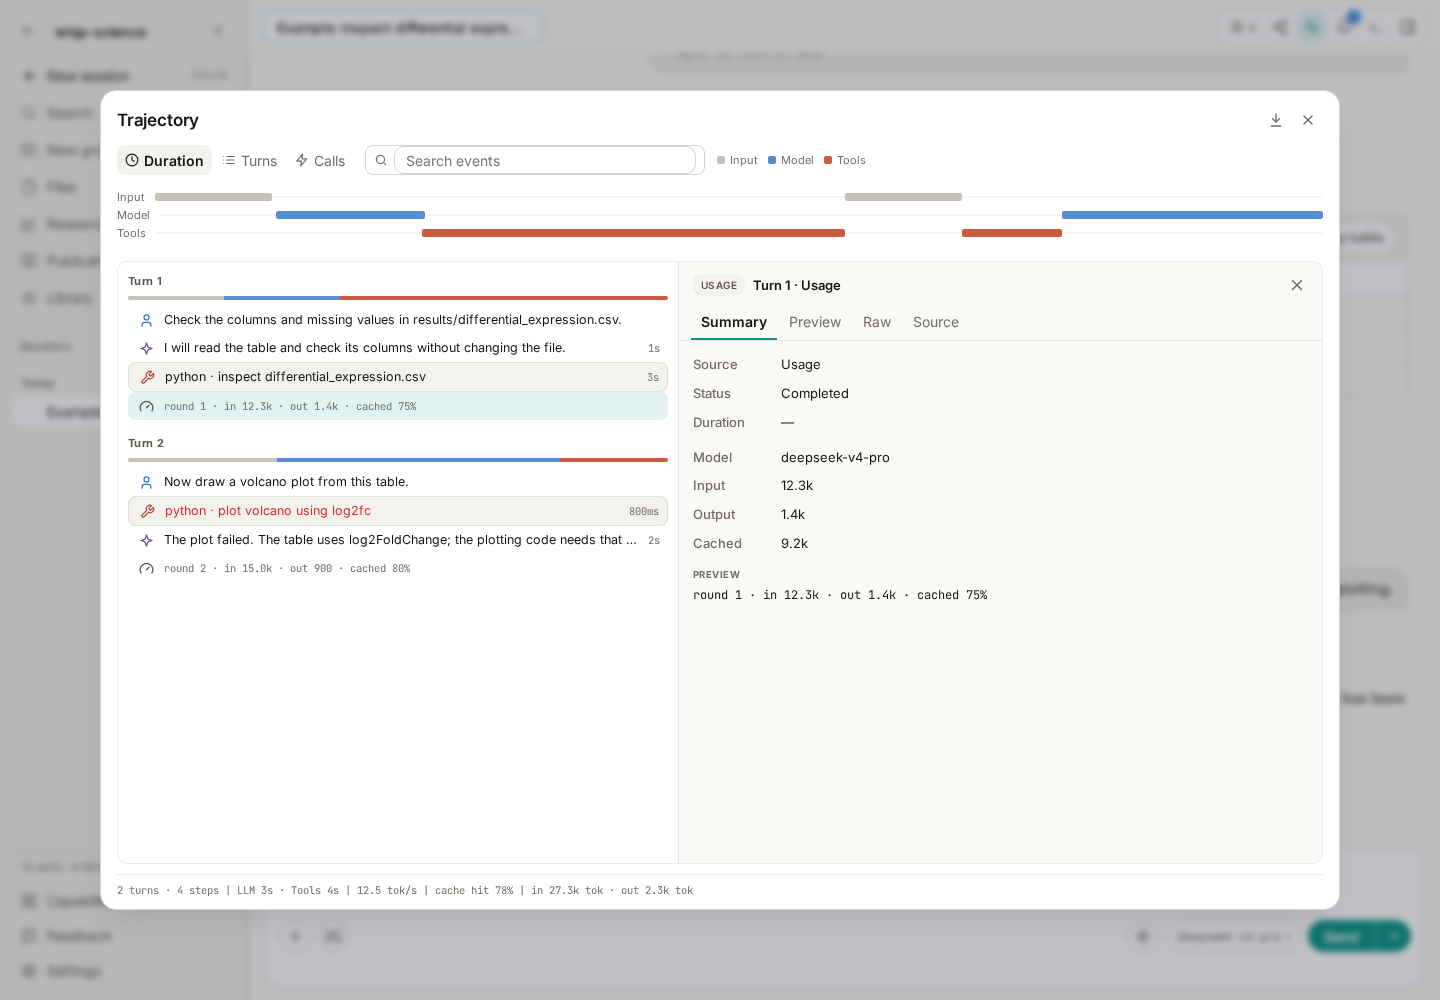
Figure 4: The right side shows usage for the selected model call; the bottom summarizes the session. Numbers are for demonstration.
Tokens are a unit used to measure model input and output. Usage records include input, output, and cache information. Summary statistics include model/tool time, output speed, and cache-hit measures.
These help review the effects of long documents, retries, or repeated calls. Actual cost depends on provider pricing and cannot be inferred from one token total alone.
An active trajectory shows live records, then refreshes from saved records after the task ends. Older conversations may lack timing or usage fields. Missing data does not mean zero time or zero usage.
Export HTML for records or collaborative review.
Click the download icon, Export HTML, at the top right and choose a destination. The result is a standalone HTML file readable in a browser.
It includes the session identifier, model, summary statistics, timeline, user inputs, replies, tool parameters/results, states, durations, and usage. Archive it with analysis notes or give a colleague context for a result or error.
Two details matter:
- Search does not narrow the export. Filtering the view to
log2fcstill exports the entire saved trajectory. - Exports use saved records. Live, unsaved content may be absent while a task is running. Wait for completion when you need a full record.
A trajectory supports inspection and traceability. Reproducing an analysis also needs input data or sources, scripts, parameters, and the environment. HTML does not bundle all those files or automatically rerun the task. Review complete inputs, paths, and tool results before sharing them.
Practice with a familiar small table.
Prepare a CSV in your project and replace the path below with its location:
Check data/example.csv and report the row count, column names, and missing values per column. Do not change the original file. If reading fails, report the actual error.
Open the trajectory afterward, find the read operation, and compare its parameters and results with the final answer in Preview. Try searching the filename and exporting HTML.
This can become part of daily analysis: verify evidence behind results, inspect errors, retain the process, and return later with a usable record.
See Trajectory View for details. This tutorial reflects the implementation when written; interface labels may vary by version.